Web app · Custom dashboards
Custom business dashboards: when the spreadsheet stops being enough
Every company has its own numbers: the ones you look at on Monday morning and make decisions on. They often live in five different places and take hours to put together. A custom dashboard collects them, calculates them the way you do and shows them to the people who need them.
The spreadsheet nobody wants to open
Orders are in the back office, payments at the bank, hours in a shared sheet, campaigns on three different platforms. Every week someone exports, copies, pastes and checks again. One wrong formula is enough for the number you decide on to be wrong, and nobody notices.
What a custom dashboard does
It connects to the sources you already use: a database, your suppliers' APIs, a back-office tool, even a Google Sheet. It calculates the numbers exactly the way you do, with your rules, and keeps them current on its own. It shows each person what they need: management sees the big picture, the warehouse sees stock, sales see their clients.
It is not generic software to bend into shape: it is built around how your company works.
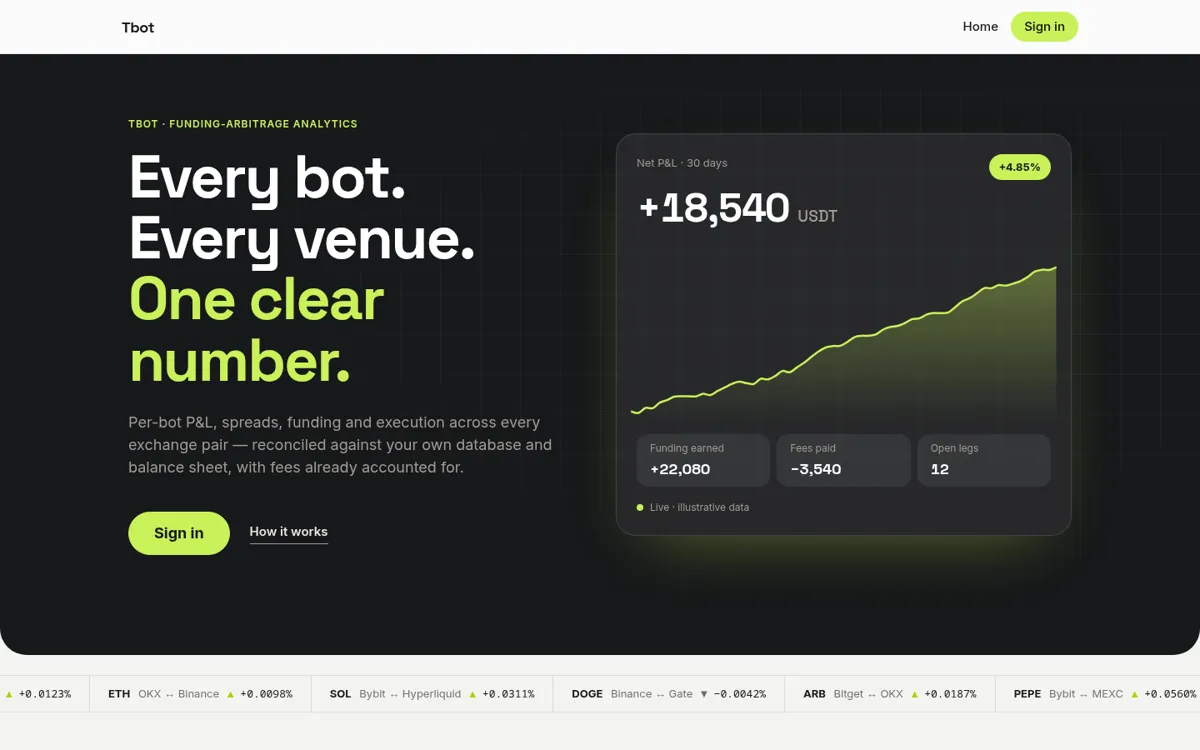
One of ours: abitrage.space
abitrage.space is an internal tool we built to analyse funding-arbitrage bots: robots that hold a long position on one exchange and a short one on another, and collect the difference in funding rates.
For every bot it shows profit and loss, spreads, funding and execution on every exchange pair, already net of fees and reconciled against the database and the real balance. Each account reads only its own encrypted database. Behind the sign-in are market data, backtests and execution quality: pages that answer precise questions, not charts added because they can be.
Custom means yours
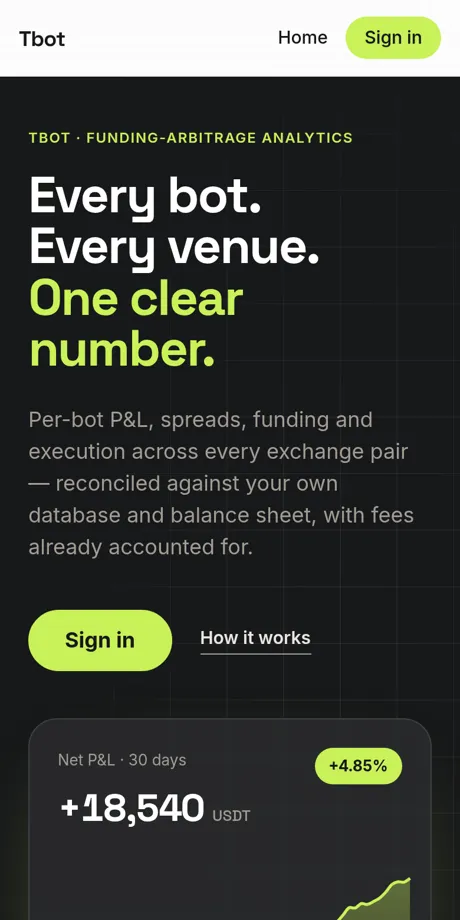
We decide together which numbers matter and how they are calculated. The dashboard opens on a computer and on a phone, stays fast with a lot of data, has users and roles, and the data stays yours. When the way you work changes, it changes too.
Where to start
With a simple question: which numbers do you look at every week, and how much time does it take to put them together? From there we design the first screen, connect it to your real data and improve it by using it.